Charts – Projects – Workload
Projects – Workload
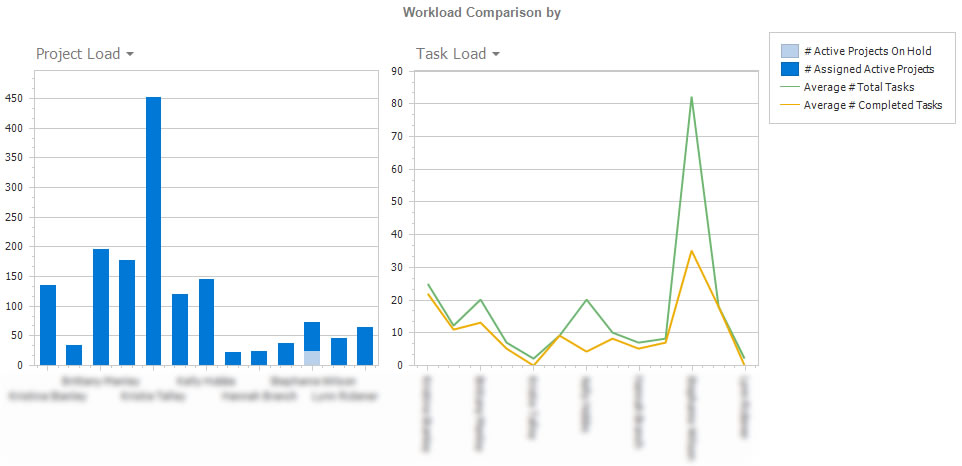
This chart shows, for each system user with the selected ‘Job Position’, the number of Projects’ assigned to them (on the left chart) and the average number of tasks and of those, average number of tasks completed.
- Requires the selection of “Job Position’.
- Only ‘Active’ ‘Projects’ are included.
- Projects on ‘Hold’ are counted and included in the graph if applicable.
- Tasks marked ‘N/A’ (default color Gray) are not included.